
JPG to Excel — Turn Table Photos into Spreadsheets
Upload a photo, scan or screenshot of a table and download it as a real .xlsx file — header row, columns and numeric cells rebuilt into a spreadsheet you can sort, sum and chart.
Drag & drop, click to upload, or paste (Ctrl+V)
JPG, PNG, WebP, HEIC, GIF, BMP · Max 10MB
The workbook is built from the tables detected in the image. If the photo has no table in it you still get the text — use the JPG to text converter for that, or paste a Markdown table straight into the Markdown to Excel converter.
Why Use This JPG to Excel Converter?
A grid, not a wall of text
Rows and columns are rebuilt as real cells, so every value lands in its own column instead of collapsing into one long line.
Numbers that add up
Value columns are written as numeric cells, so SUM, sorting and charts work on arrival rather than being blocked by text.
Formatting already done
Header row styled and frozen, filters switched on, column widths fitted, one worksheet per table.
A table photo is a harder problem than a page of text
Reading the characters inside a table is the easy half. The hard half is rebuilding the grid: deciding where one cell ends and the next begins, which row is the header, whether a line belongs to the cell above it or is a footnote, and whether a number is a value or a unit.
Prose only has to survive as paragraphs, so a character-level OCR pass is usually enough. A table has structure inside it — aligned columns, spanning headers, cells that wrap over three lines — and all of it has to come back as cell boundaries rather than as whitespace. That is why pasting a table photo into a generic text extractor gives you a correct-looking block of words with the columns collapsed into one: the characters are right, the layout is gone.
So this page converts in two steps. The image is first read as an explicit table — every row and column named — and that table is then rebuilt as a real worksheet with one cell per value. Keeping the two steps apart is what keeps the columns apart.
What the workbook actually looks like
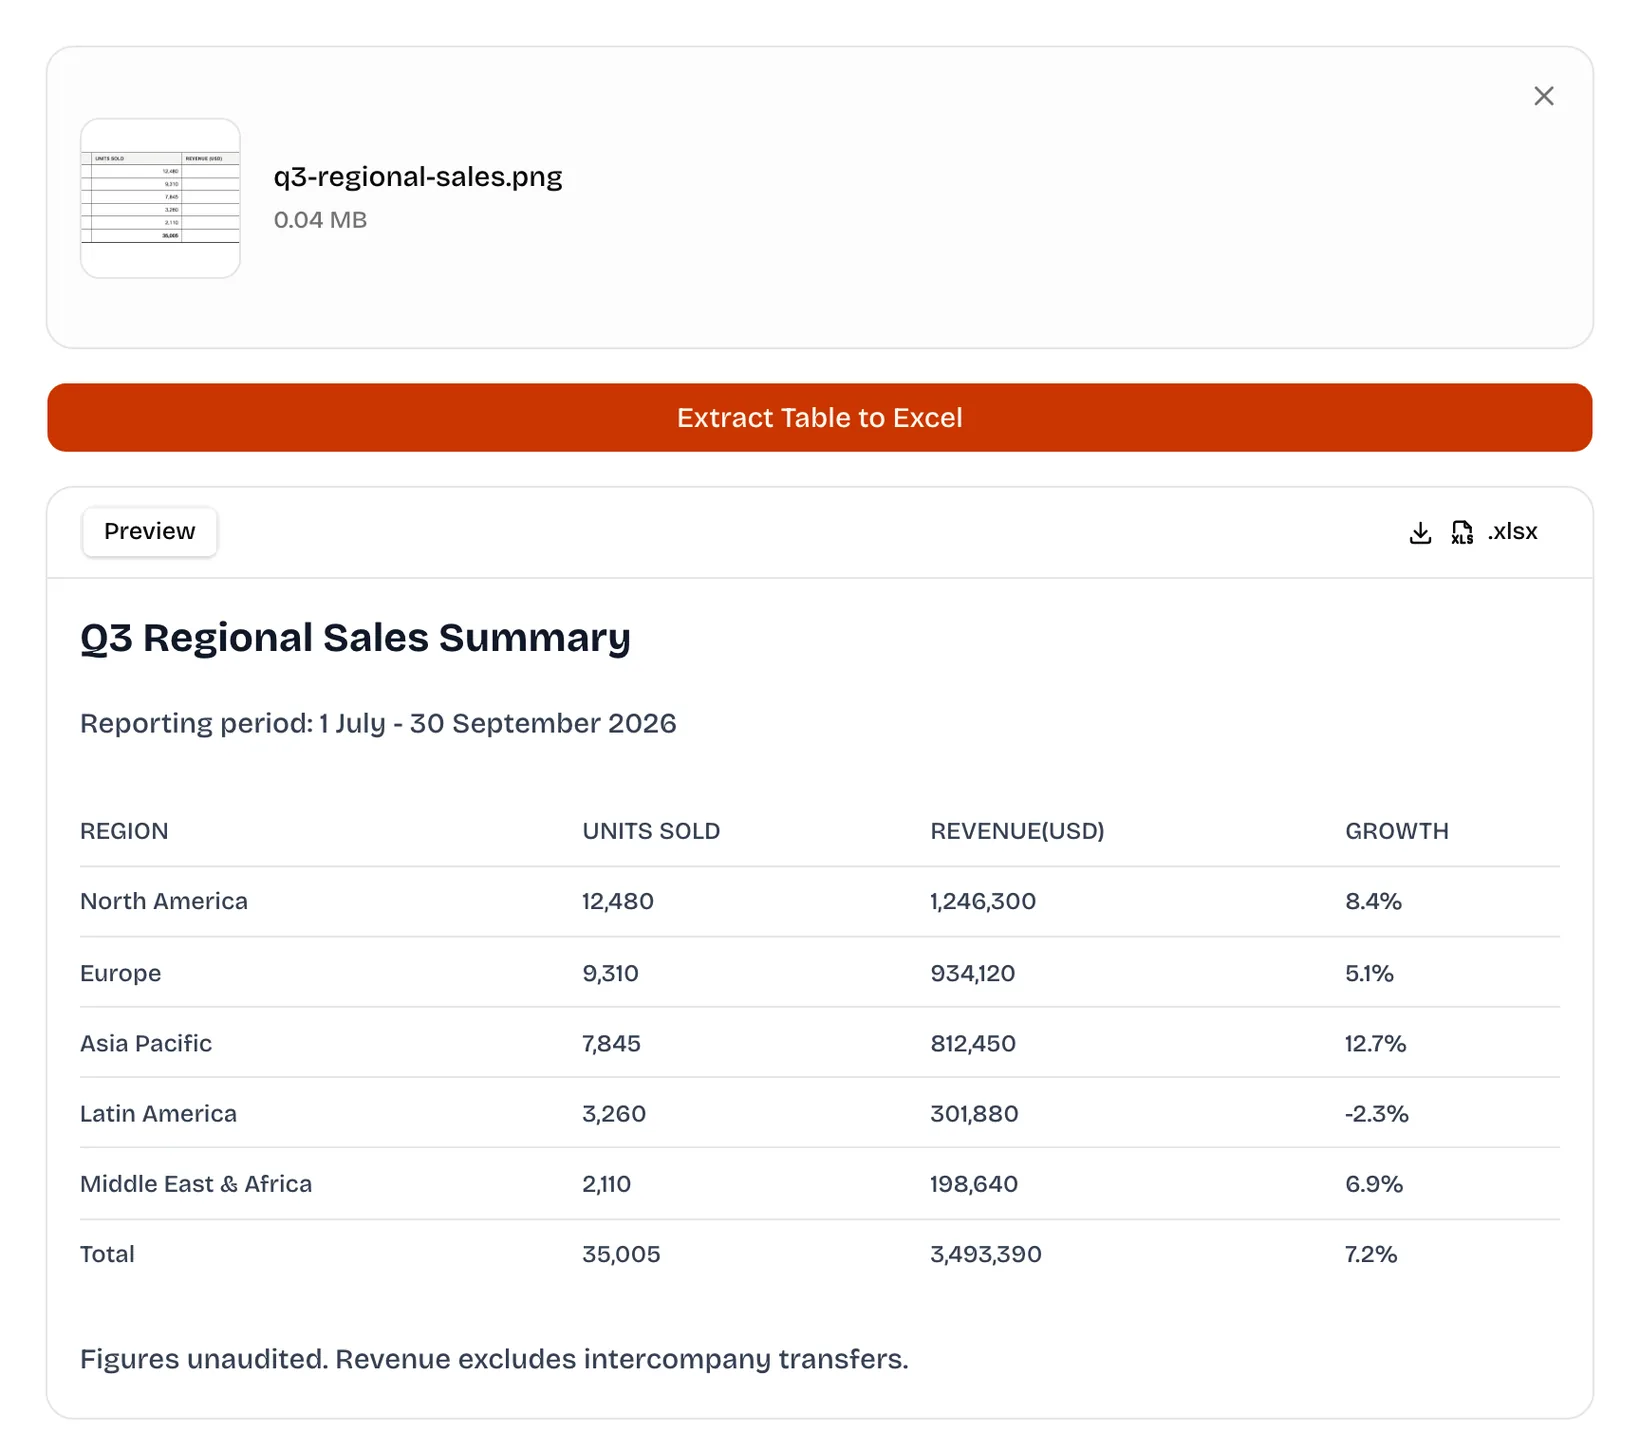
A table from a printed report, read straight out of the image: the values come back in the right columns, the header row is styled and frozen, and the amount column is written as numbers — select it in Excel and the sum is already in the status bar.
- One worksheet per table found in the image, so two tables on a page do not merge into one grid.
- The header row is styled, frozen and filtered — scroll five hundred rows and the column names stay put, and every column has a dropdown.
- Numeric cells are written as numbers, not as text with a number inside it.
- Column widths are fitted to the widest value, and long cells wrap instead of spilling over the next column.
- The download is a standard .xlsx: Excel, Google Sheets, Numbers and LibreOffice Calc all open it without a converter.
Which table images convert well — and which do not
The format matters less than the geometry. Anything with a visible border and an even exposure is close to a solved problem; anything where the grid exists only in the reader’s head is not.
- The best case is a screenshot of a web table or a spreadsheet — no perspective, no compression, every border exactly where it should be.
- A photo of a printed table taken from above is reliable, provided all four edges of the table are inside the frame.
- A scanned page at 150 dpi or more is fine; below roughly 100 dpi the ruling lines start to bleed into the type.
- A table that runs over a page break comes back as two worksheets — convert both pages and merge in Excel, or keep them apart.
- A handwritten ledger is recognised digit by digit, but the grid has to be inferred from ruled lines: expect to correct a few cells.
- A table with rules under each row but nothing between the columns can come back one column too wide — with no vertical line to stop it, the gap between the first and second column gets read as a column of its own. A grid drawn on all four sides avoids it entirely.
- A “table” built from tabs and spaces with no ruling lines at all is the most common failure — the whole thing is read as a single column.
What gets lost, and why
Two kinds of structure do not survive the rebuild, and both are worth knowing before you run a table you actually care about.
Merged cells cannot be reproduced. A header spanning three columns arrives in the first of them, with the others left empty — the values are all present, the merge is not. A two-storey header, “Revenue” over “Q1 / Q2 / Q3”, is flattened into a single row of column names, because a grid rebuilt from rows has no way to know the upper row was a group label.
Everything else — row order, column order, the values themselves — comes through as the model read them. Nothing is re-sorted, totalled or reformatted behind your back, so the sheet you check is the sheet you download.
Shooting a table so the grid survives
Accuracy is decided before the file is uploaded. Six things matter, roughly in this order:
- Get all four borders in frame. Table detection needs an edge — a table cropped at the right margin loses its last column.
- Shoot from directly above. A twenty-degree angle turns the far rows into slivers and makes cells at the bottom taller than cells at the top.
- Keep the header in the same photo as the body. A header photographed on its own is read as a one-row table and never reattached.
- Light the page evenly. One flash reflection across row four is a row you will be retyping.
- Leave a margin. A little white space around the table is what tells the model where the table ends.
- 150 dpi is plenty for 10–12 pt type. Upscaling a small photo in an image editor adds pixels, not information.
How to Convert a JPG to Excel
- 1Drop your .jpg or .jpeg file onto the upload area, click it to browse, or paste a screenshot with Ctrl+V.
- 2Press “Extract Table to Excel” — the table in the image is read and rebuilt as rows and columns.
- 3Check the preview: the grid shown on the page is the grid written into the workbook.
- 4Click “.xlsx” in the result toolbar to download it, then open in Excel, Google Sheets, Numbers or LibreOffice.
What you get from different kinds of image
Same tool, very different results — the deciding factor is whether the table has a drawn grid and whether the whole of it is in frame.
| Image | What comes out | Watch out for |
|---|---|---|
| Screenshot of a web or app table | One clean worksheet | Almost nothing — this is the reliable case. |
| Photo of a printed report | One worksheet, numbers typed | Glare, and columns cut off at the frame edge. |
| Scanned invoice or statement | One worksheet, usually clean | Scans under 100 dpi merge the ruling lines with the type. |
| Table split across a page break | Two worksheets in one workbook | The totals row arrives alone on the second sheet. |
| Handwritten ledger | An approximate grid | Digits are read well; cell boundaries are guesswork. |
| Table with no ruling lines | Often a single column | Nothing in the image marks where a column ends. |
Frequently Asked Questions
How do I convert a JPG to Excel?
Drop the .jpg onto the upload area, click it to browse, or paste a screenshot with Ctrl+V, then press “Extract Table to Excel”. The table in the image is rebuilt as rows and columns on the page, and the “.xlsx” button in the result toolbar downloads the workbook. Nothing to install, no account needed.
Does the image have to contain a table?
Yes. The workbook is built from the tables found in the image, so a photo of a paragraph of prose gives you the text but no spreadsheet — the export will tell you it found no tables. If you only need the words, use the JPG to Text converter instead.
Can it read a table from a phone photo, not just a scan?
Yes — a straight-on phone photo of a printed table is the main use case. Accuracy falls with tilt, glare and shadow: shoot from directly above, keep all four edges of the table inside the frame, and avoid flash on glossy paper.
What happens if the image has several tables?
Each table becomes its own worksheet in a single .xlsx file, so a page with two tables gives you two tabs rather than one merged grid. Sheets are named Table 1, Table 2 and so on.
Are numbers stored as numbers or as text?
As numbers. A column of amounts is written to numeric cells, so SUM, sorting and charts work the moment the file opens. Text-typed numbers are the usual reason a pasted table refuses to calculate — Excel counts the cells instead of adding them.
What about merged cells and multi-row headers?
A merge cannot be reproduced, because the worksheet is rebuilt from rows of values. A header spanning three columns arrives in the first of them with the other two left empty, and a two-storey header is flattened into one row of column names. The data survives; the visual structure does not.
Which file formats and sizes are supported?
JPG and JPEG, plus PNG, WebP, HEIC, GIF and BMP — formats other than JPG and PNG are converted to PNG in your browser before upload. Up to 10 MB per image, with no daily limit and no page limit.
Is the image stored, and is it really free?
The image is sent to the OCR model, read, then discarded — not written to disk, not stored in a bucket, not used for training. The tool is free, with no account, no watermark and no quota to unlock.